The Case for Increasing Public Defense Funding in the Bay Area

handcuff
intro
pd
barchart
Funding Priorities within Bay Area Counties

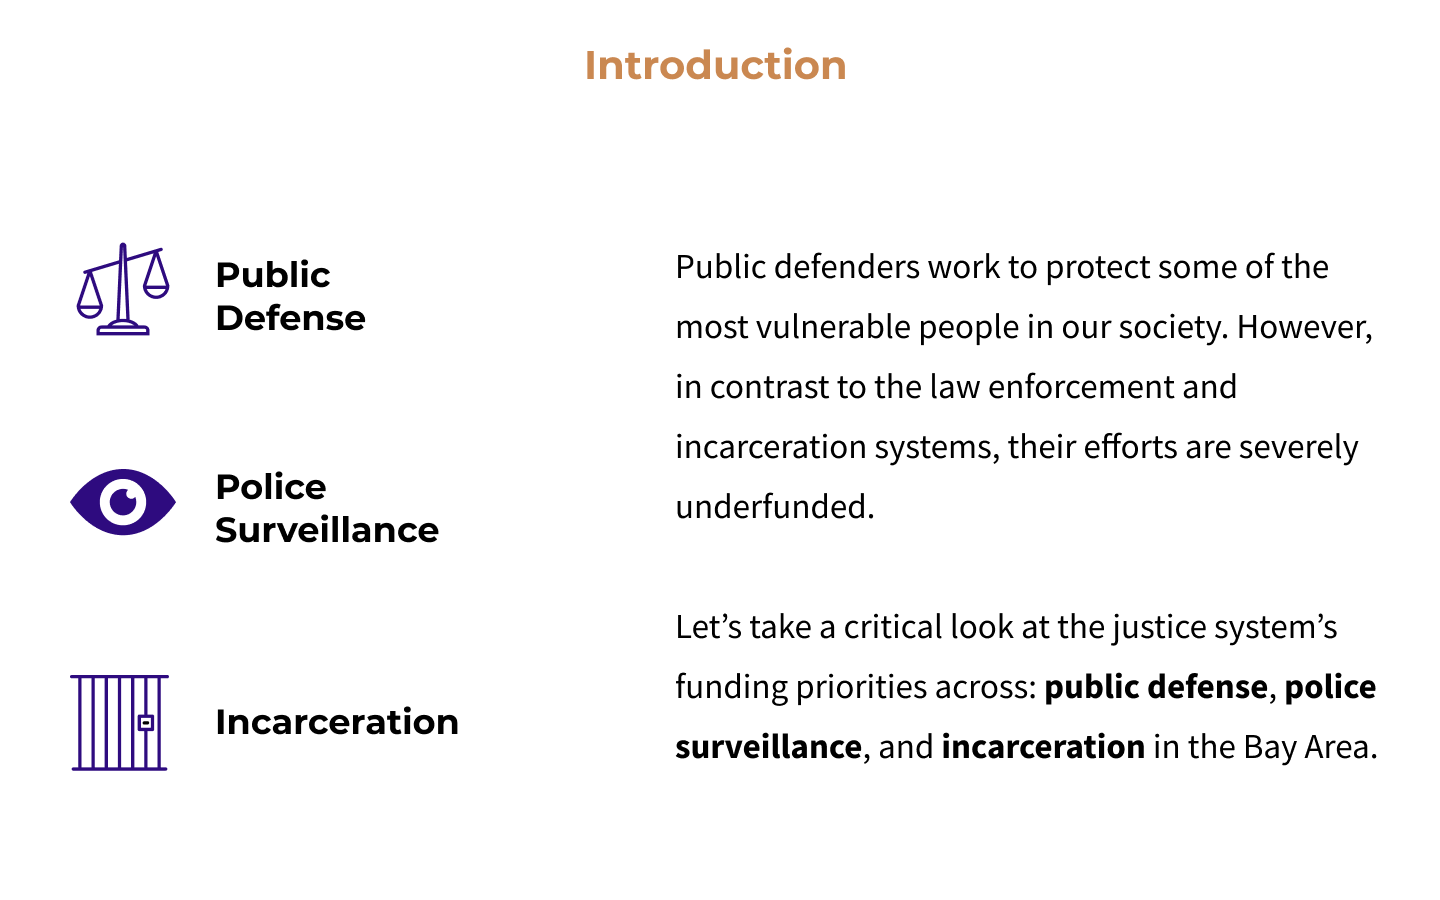
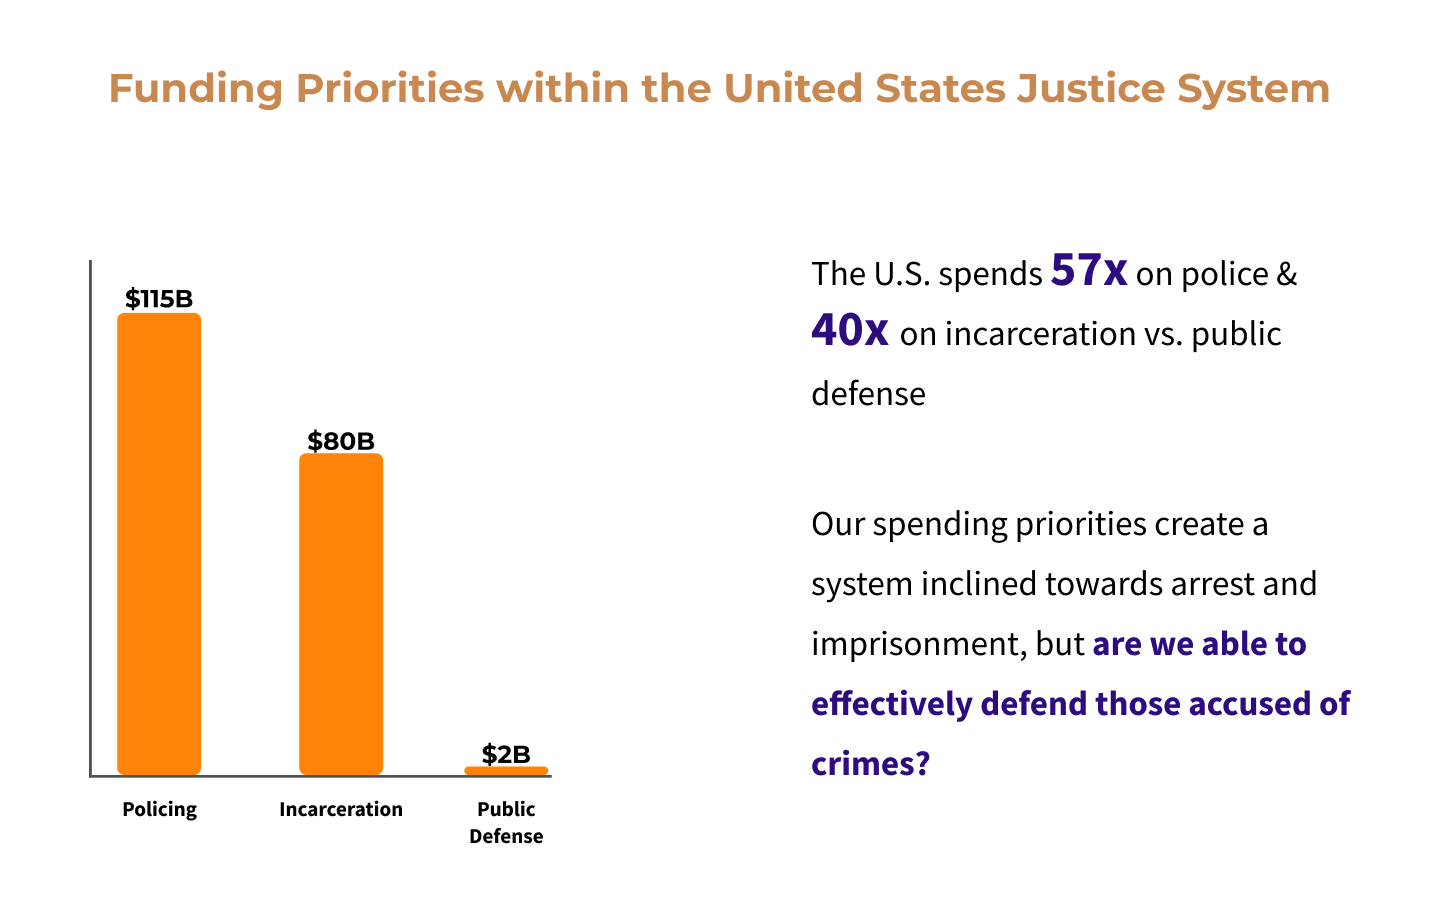
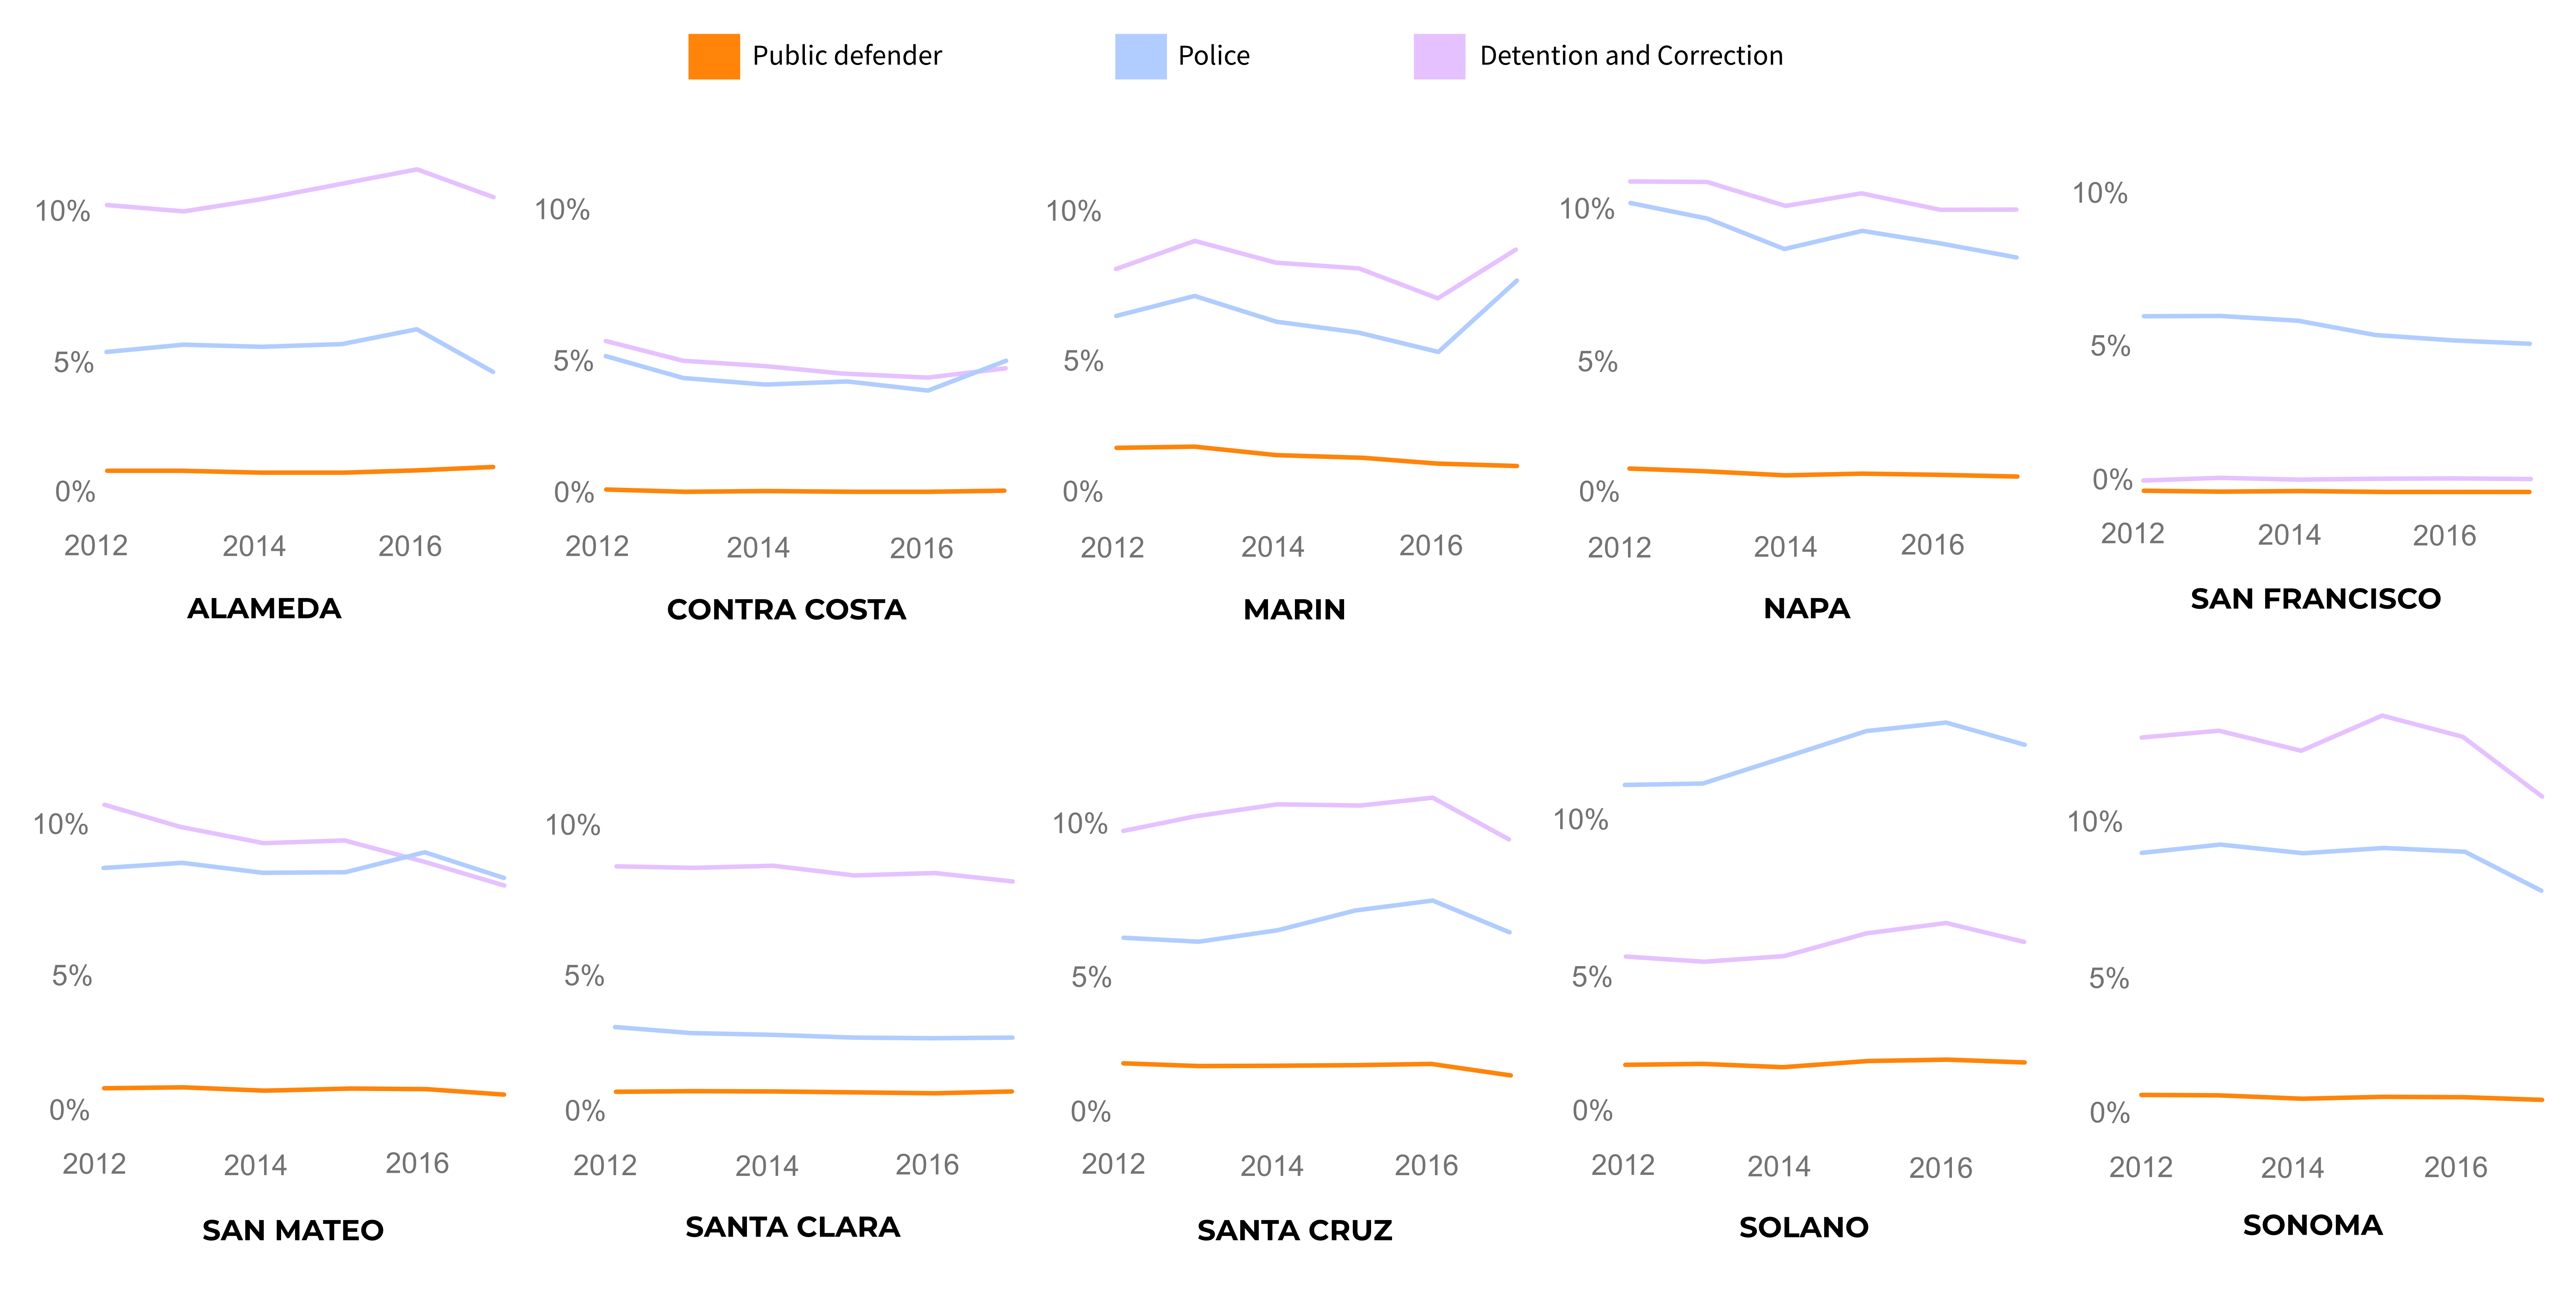
Bay Area counties consistently spend more on law enforcement and detention and corrections, compared to public defense.


county expenditure
Public Defenders are Underfunded and Overworked

The bar association recommends: a) public defenders who handle misdemeanor cases work no more than 400 cases a year b) those who handle felony cases work no more than 150 cases a year.


public defender caseload in alameda

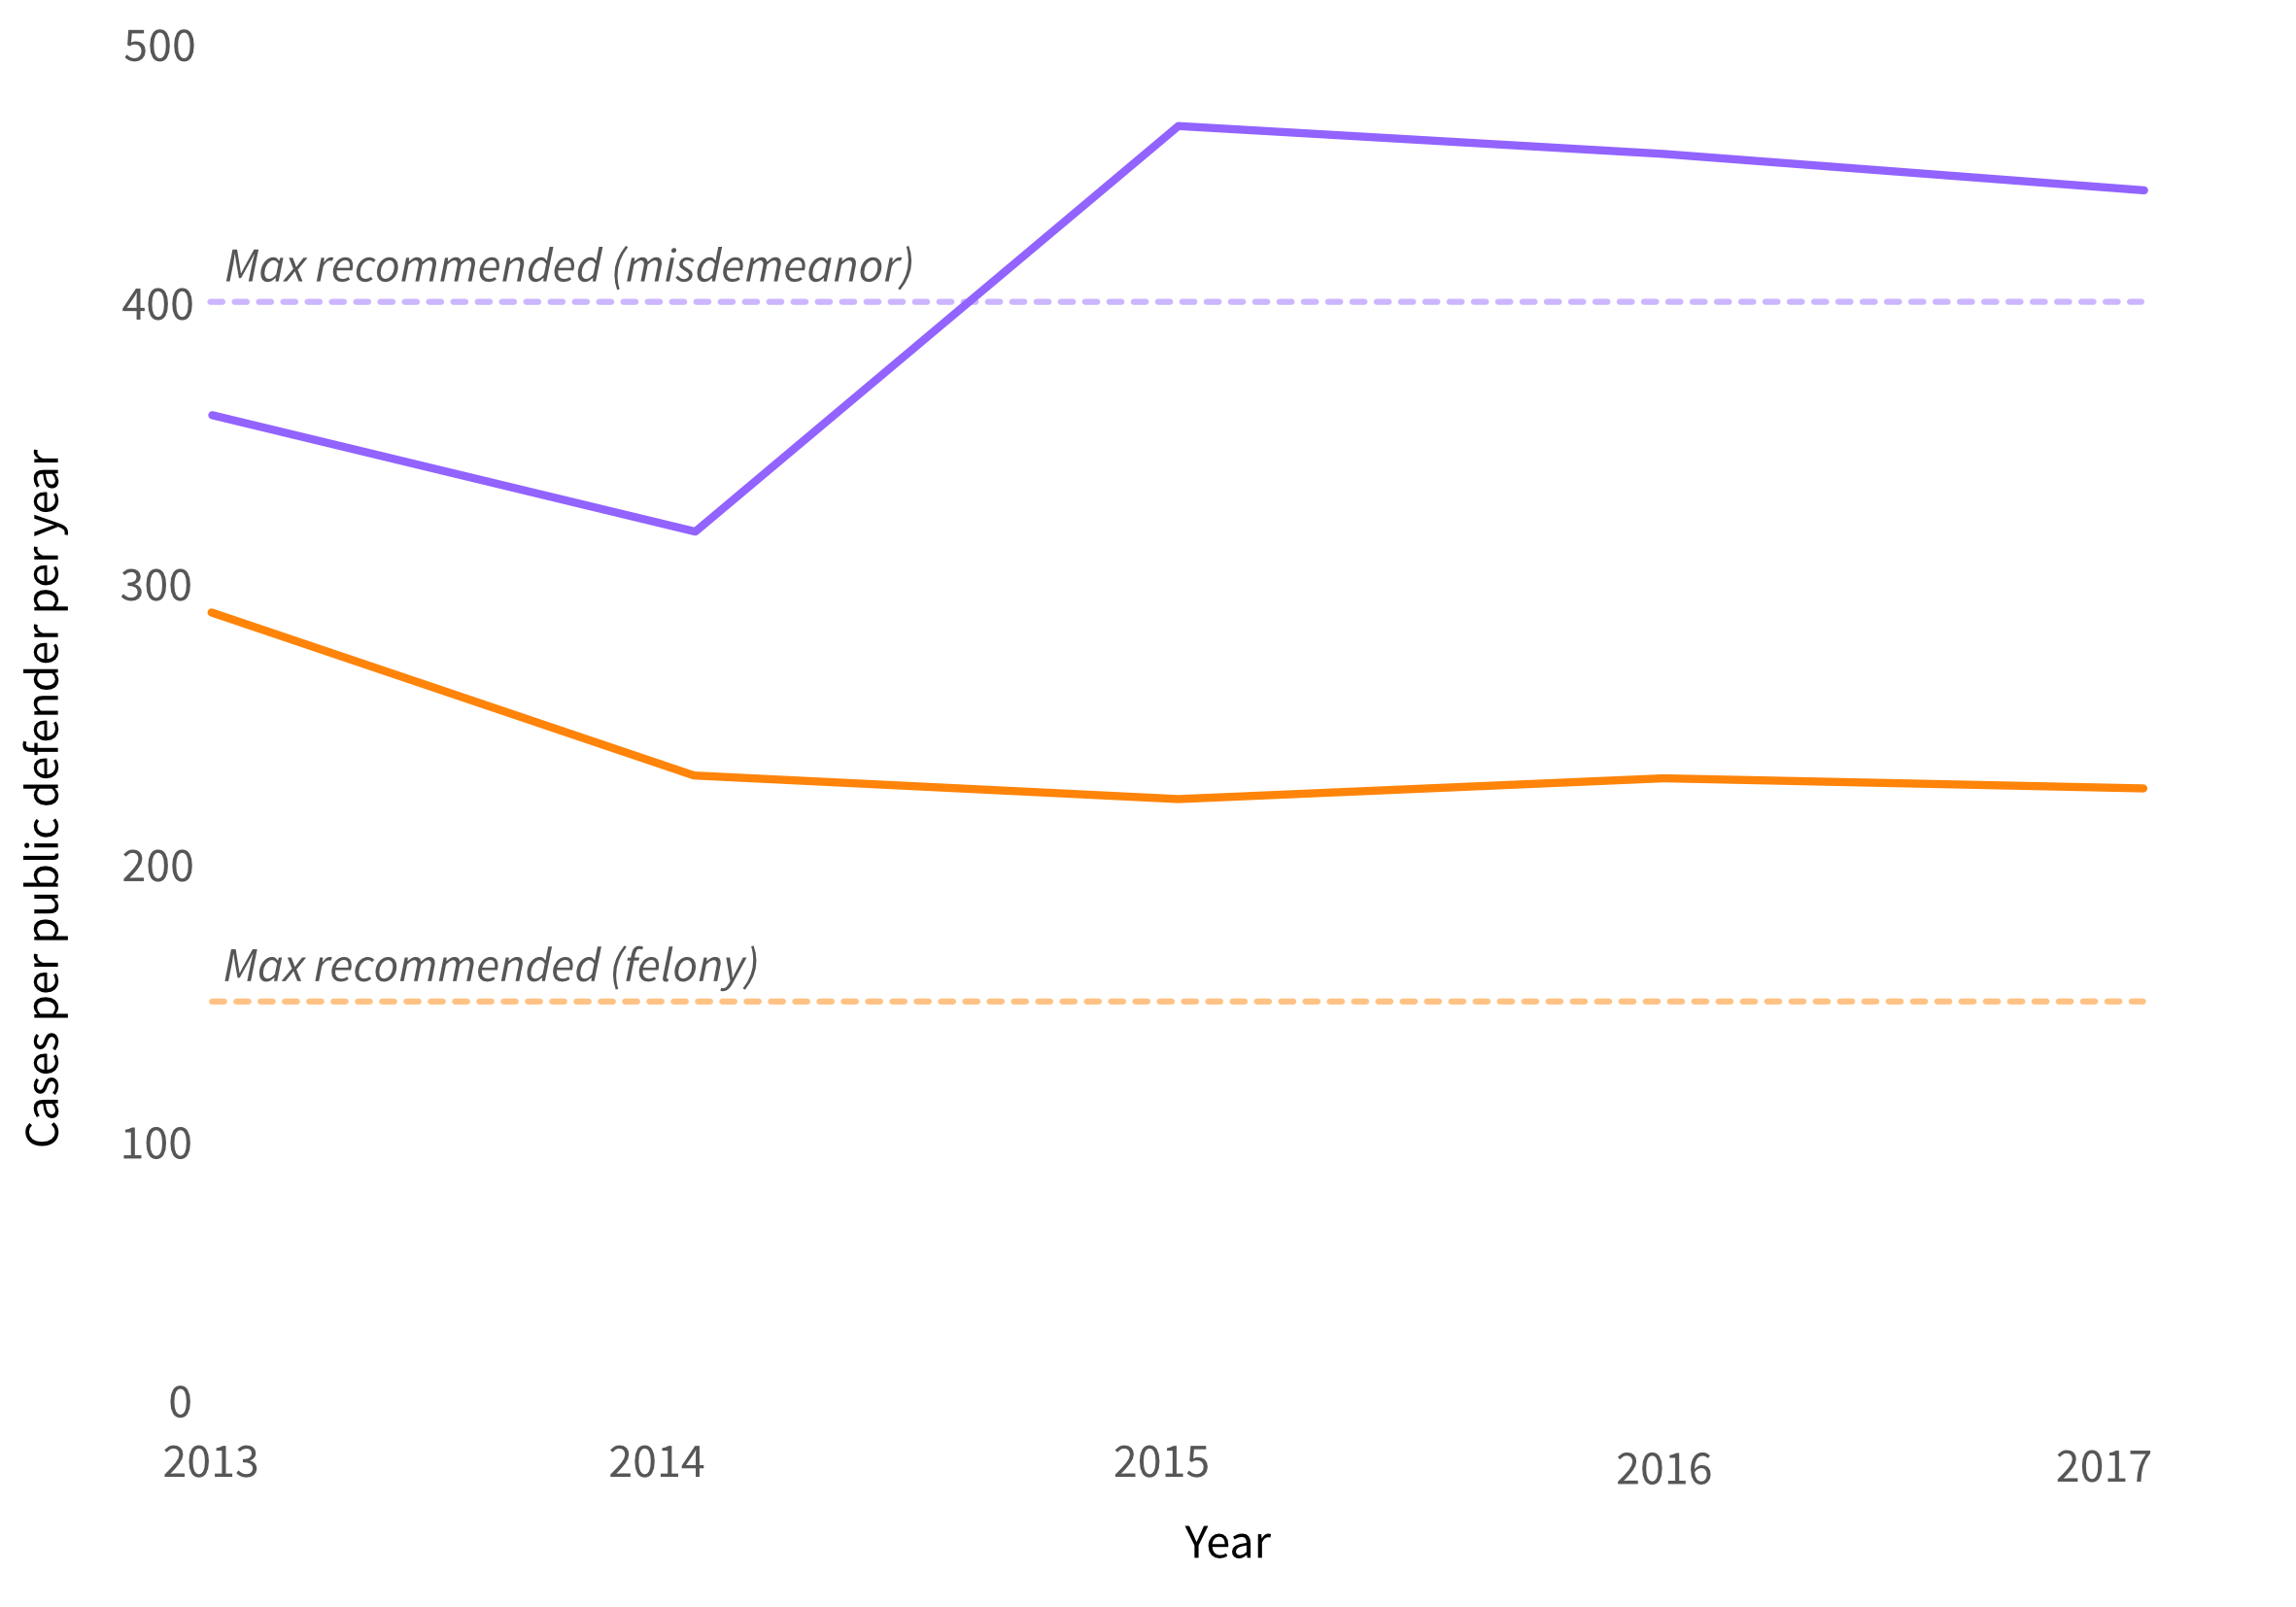
Unfortunately, public defenders often need to go over these limits. Here, you can see the caseloads for Alameda county. A misdemeanor is a less serious crime than a felony and carries lighter penalties. Thus, more time is required for public defenders to work on felony cases.

How Do Bay Area Law Enforcement Use Their Funding?
Often, for surveillance.

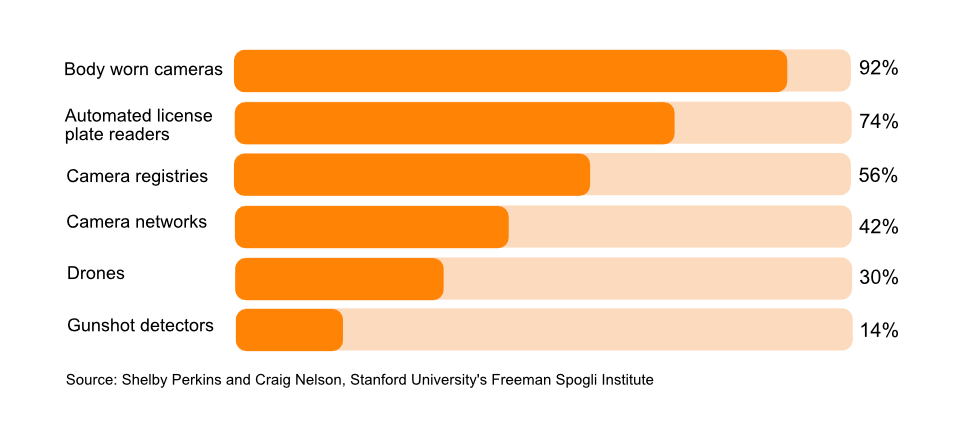
Bay Area law enforcement use their funding to acquire many surveillance technologies. Take a look at the percentage of Bay Area cities whose law enforcement use the following surveillance technologies.


Percentage of Bay Area Cities That Use Major Surveillance Technologies

pop-tech

Most Frequently Cited Terms in Federal Grants to Bay Area Law Enforcement, 2010-2020


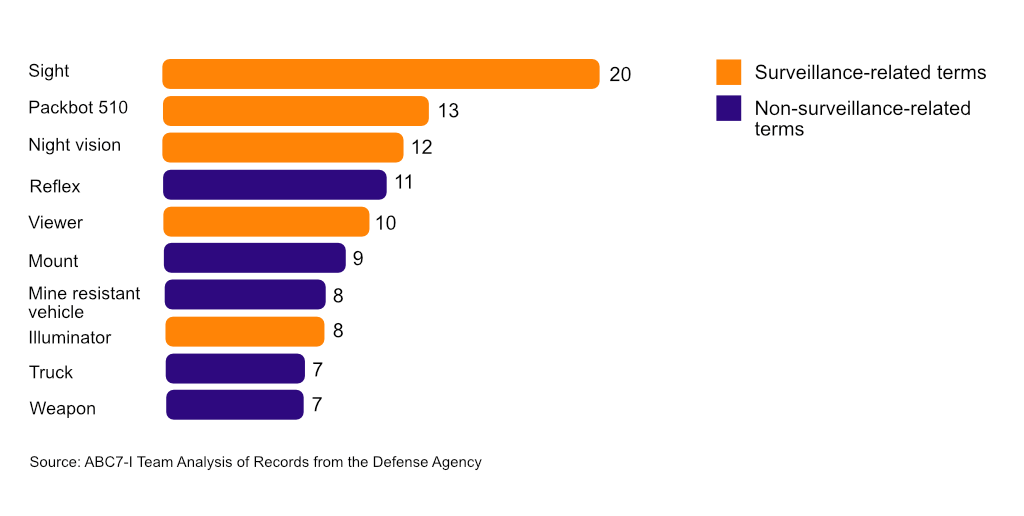
In addition to state and county funding, Bay Area agencies receive millions of dollars of technology through federal grants. Between 2010 and 2020, the Bay Area received $11.9 million worth of technology through federal grants. The most frequently cited terms in federal grants to Bay Area law enforcement relate to surveillance (e.g. "sight," "vision," and "illuminator").

fed-grants

San Francisco law enforcement use 43 different surveillance technologies.


Take a look at the surveillance technologies that San Francisco law enforcement use. Hover over the nodes to see how they're categorized


What major surveillance technologies does your city's law enforcement use? Select your city below.


quote quote2
California's Jail System: Population, Bail, Funding Priorities

Disproportionate Race Distribution in California Jails (1985-2018)


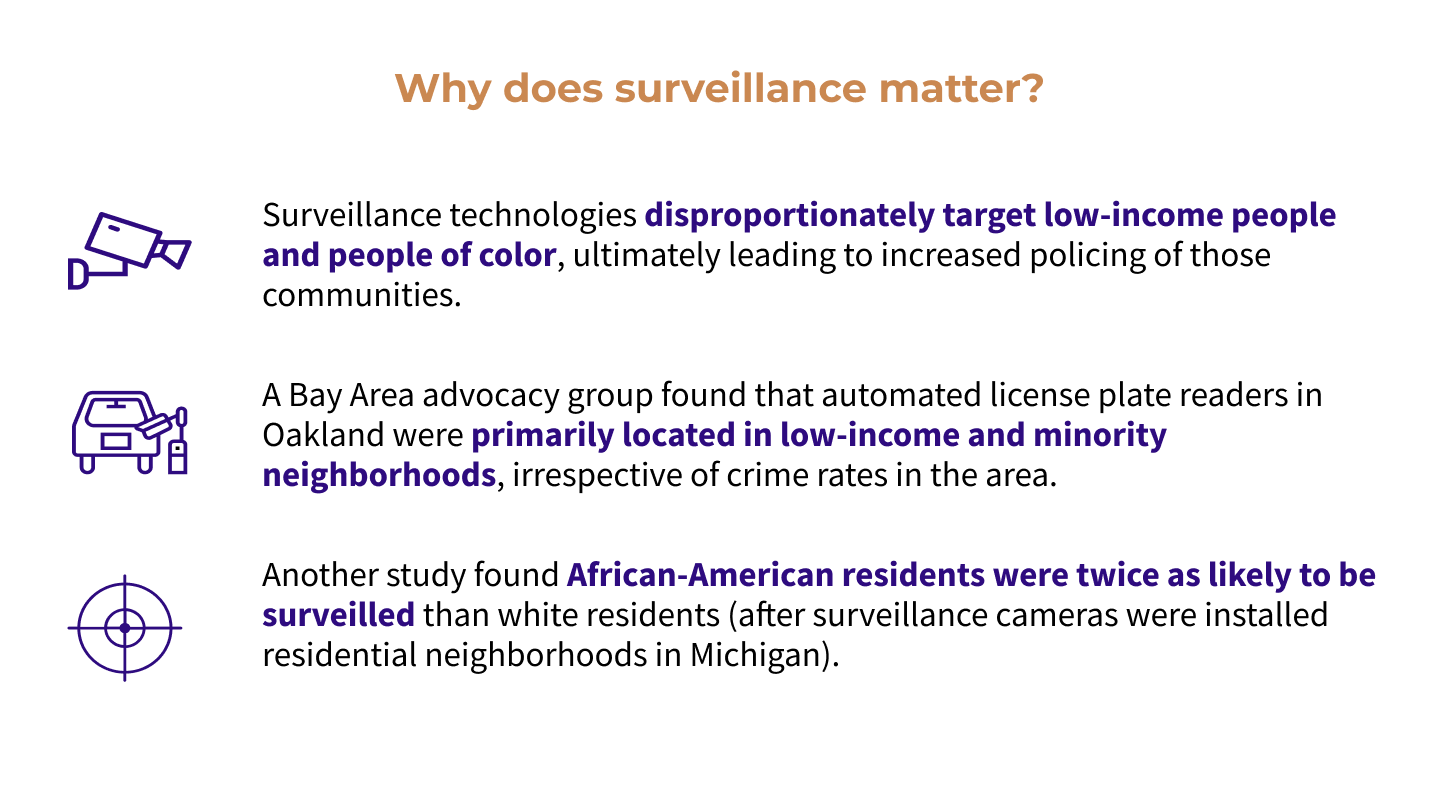
One outcome of biased policing and surveillance technologies used to target people of color is: a disproportionate racial make up of jails. For example, Black people make up 6% of California's population, but they represented 21% of the jail population in California in 2018.

*Pause the visualization on the bottom left to view jail populations for a particular year

California's Jail Population is Largely "Pre-Trial"


As of 2018, 64% of the jail population in California is pre-trial, meaning they are still waiting for their case to reach a judge. However, this is in contrast to the Sixth Amendment, which guarantees the right to a public trial without unnecessary delay.

*Hover on top of the line chart to see population values

jaillegend

High Bails Contribute to Large Pre-Trial Jail Population


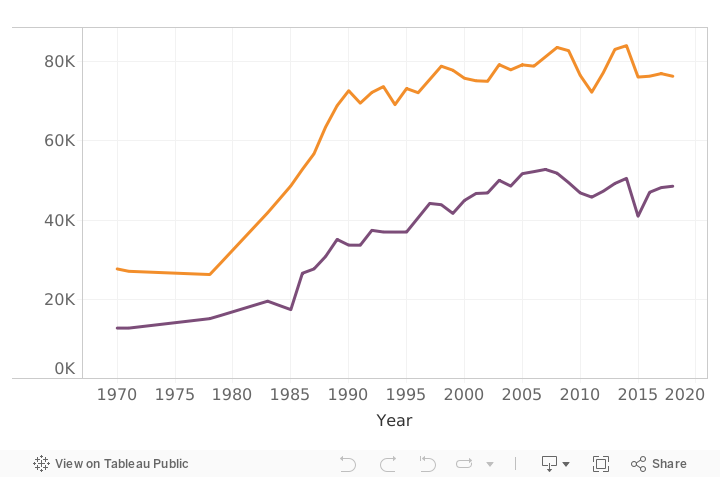
California's total jail population has increased by 175% from 1970-2018, in part this could be because of the high cost of bail and heavy case load burden faced by public defenders.


bail

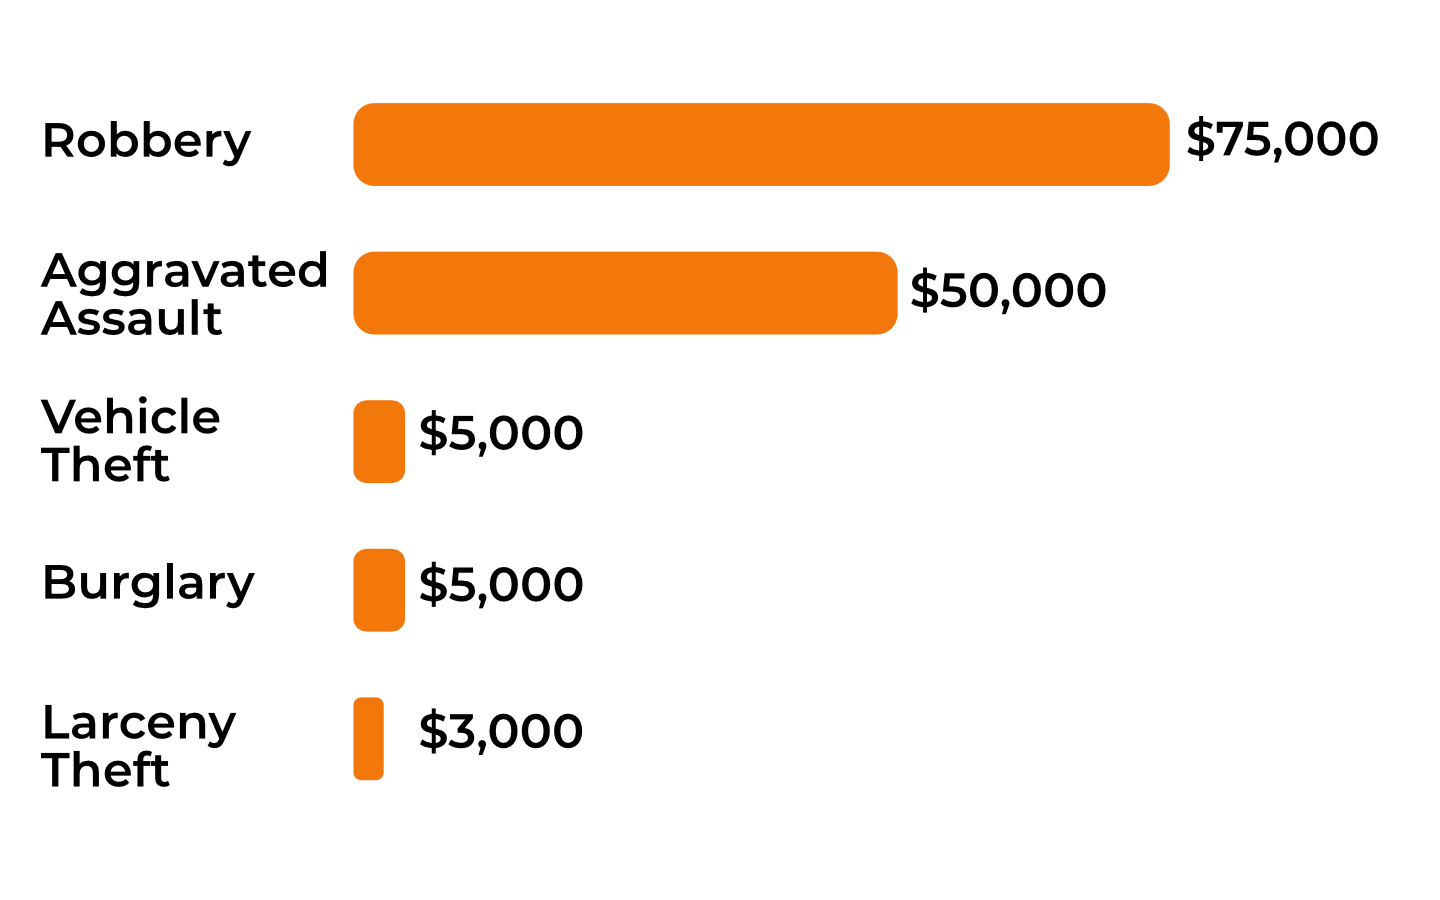
*Bail amounts for common San Francisco offenses

California's Correction Department does not Prioritize Rehabilitation


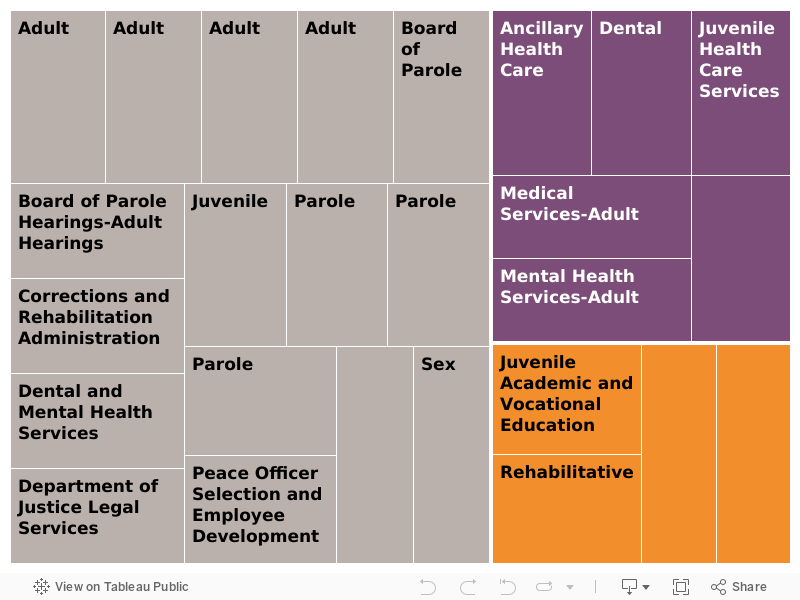
Between 2021-2022, California plans to spend $13 Billion dollars on its Corrections & Rehabilitation Department. 68% ($9 Billion) of this funding will be spent on administrative oversight activities and operations. Only 4% ($541 Million) will be spent directly on rehabilitative services. Are these the spending priorities of a progressive system?

*Hover on top of the visualization to learn more about a specific program and its funding amount. Values are listed in total dollars.

treemaplegend
imp
References
  1. Hero Image: https://www.nytimes.com/2016/02/19/opinion/when-the-public-defender-says-i-cant-help.html
  2. Miranda Rights: http://www.mirandawarning.org/whatareyourmirandarights.html
  3. Comparative Bar Chart (Police, Incarceration, Public Defense): https://www2.census.gov/programs-surveys/gov-finances/tables/2018/alfin_summary_brief.pdf https://www.bjs.gov/content/pub/pdf/sgide0812.pdf https://www.themarshallproject.org/2019/12/17/the-hidden-cost-of-incarceration#:~:text=The%20Bureau%20of%20Justice%20Statistics,2.3%20million%20people%20behind%20bars.
  4. Percentage of Bay Area Cities That Use Major Surveillance Technologies & What major surveillance technologies does your city's law enforcement use?: Shelby Perkins and Craig Nelson from Stanford University's Freeman Spogli Institute; https://www.sfpublicpress.org/why-law-enforcement-should-publicize-surveillance-policies-procedures/
  5. Most Frequently Cited Terms in Federal Grants to Bay Area Law Enforcement, 2010-2020: ABC7-I Team, who retrieved records from the Defense Agency; https://abc7news.com/bay-area-police-equipment-petaluma-mrap-receives-most-military-pd/6281864/
  6. Take a look at the surveillance technologies that San Francisco law enforcement use: San Francisco’s Committee on Information Technology (COIT); https://sfcoit.org/SurveillanceInventory
  7. Race Distribution of Jailed Persons (1985-2018): https://github.com/vera-institute/incarceration-trends
  8. California Jail Pretrial Population & Bail: https://github.com/vera-institute/incarceration-trends
  9. Is California's Corrections Department Spending Socially Progressive?: http://www.ebudget.ca.gov/budget/2021-22/#/Home
  10. San Francisco Expenditure Data: http://openbook-report.sfgov.org/OBMiddleware/report.aspx?reportname=1
  11. Other Bay Area County Expenditure Data: https://counties.bythenumbers.sco.ca.gov/
  12. Alameda Public Defender Caseload: https://acgov.org/MS/OpenBudget/pdf/FY17-18/Public%20Defender%20Budget%20Presentation%202017-06-27.pdf